

The before-and-after slide had two charts. The wrong one was winning.
I’ve been in a lot of these meetings. A year into the AI program, the delivery lead pulls the Git history for the review: the changes made to the code, the number of typed lines, the raw volume. It’s flat. After a year of paying for licenses and mandating usage, the graph shows no one ever plugged the thing in. You can see the sponsor in the next seat doing the math in their head on how to justify cutting this expense from next year’s budget.
The second chart is usually not made. It is usually the one that tells the story, too. Same team, same year: completed work up by half. Both charts are equally true. An organization that draws only the first chart will conclude AI did nothing, and cut the budget that was quietly working.
That is the real before-and-after of AI adoption. The work gets denser, not bigger... and a dashboard built to watch volume will not show it.
Issue 1 named the trap: sequencing.
Issue 2 named the destination: AI-native, not AI-ready.
Issue 3 put three bodies on the table that have to move together.
Issue 4 climbed inside the AI capability and asked for one number: the acceptance rate.
Issue 5 found Herbie: your bottleneck doesn’t burn tokens.
Last week, I promised to open the field notebook: what it actually looks like when a shop moves its constraint, and the before-and-after numbers that survived contact with reality. There is one problem. My numbers are anonymized, mine, and hedged. When a consultant shows you their own before-and-after, you should take it with a grain of salt. (Yes, even mine.)
So this week, the notebook gets a new witness. A peer-reviewed study spent 13 months watching someone else’s shop and documented the same story I keep watching happen without them, p-values and all.
No kit this week, last week’s prompt still works. It’s just the argument this week, along with the standing ask: subscribe, run the three checks near the end on your own delivery data, and let me know which chart your CFO saw first.

Someone finally ran the experiment
At FORGE 2026 (the IEEE/ACM conference on AI foundation models and software engineering), Rafael Tomaz, Paloma Guenes, Allysson Allex Araújo, Maria Teresa Baldassarre, and Marcos Kalinowski published a study on three agile teams in one of the world’s biggest IT consulting companies, running for around thirteen months. Real client projects, oil and gas plus maritime logistics, 21 developers under commercial pressure, October 2023 to November 2024.
What makes it rare, first of all, is a clean before. External GenAI tools were banned at the firm until the study kicked off, so the historical sprints are genuinely tool-free... and you almost never get that baseline in the wild. The measurement side is also better than most: Jira, SonarQube and Git telemetry before and after, cross-checked against surveys, organized by the SPACE framework (Forsgren, Storey, Maddila, Zimmermann, Houck and Butler, ACM Queue, 2021), the model that refuses to reduce developer productivity to one number.
And they did a proper rollout. Included all the bells and whistles. Copilot licenses. Plus an internal GPT tool. Kickoff. A two hour prompt-engineering workshop. A dedicated channel for swapping prompts. If your transformation office had this on a slide, they would call it best practice. Hold that thought.
The usual caveat, so nobody accuses me of hiding it: three teams, twenty-one developers, one firm. Carry these numbers with the same care as last week’s sixteen METR maintainers. What the paper lacks in scale it makes up for with length, and the dataset is open if you want to check their homework.
The chart that would have killed the program
In the team the researchers could track cleanly across the whole window, completed story points rose by 59.1 percent. From 281 to 447. Statistically significant. Medium effect sizes. Perceived efficiency agreed, roughly four in five developers reporting faster delivery and less repetitive work.
Activity, though? Across 349 commits and roughly 456 thousand lines, the difference in committed lines before and after came out at p = 0.928. For the non-statisticians: that is the test equivalent of a shrug.
The authors admit as much in their own conclusion. Had they measured activity alone, they would have concluded GenAI had no impact. Throughput up 59 percent while the commits dashboard swears the machine is unplugged.
Their name for the phenomenon is value density. More value per unit of work rather than more work.
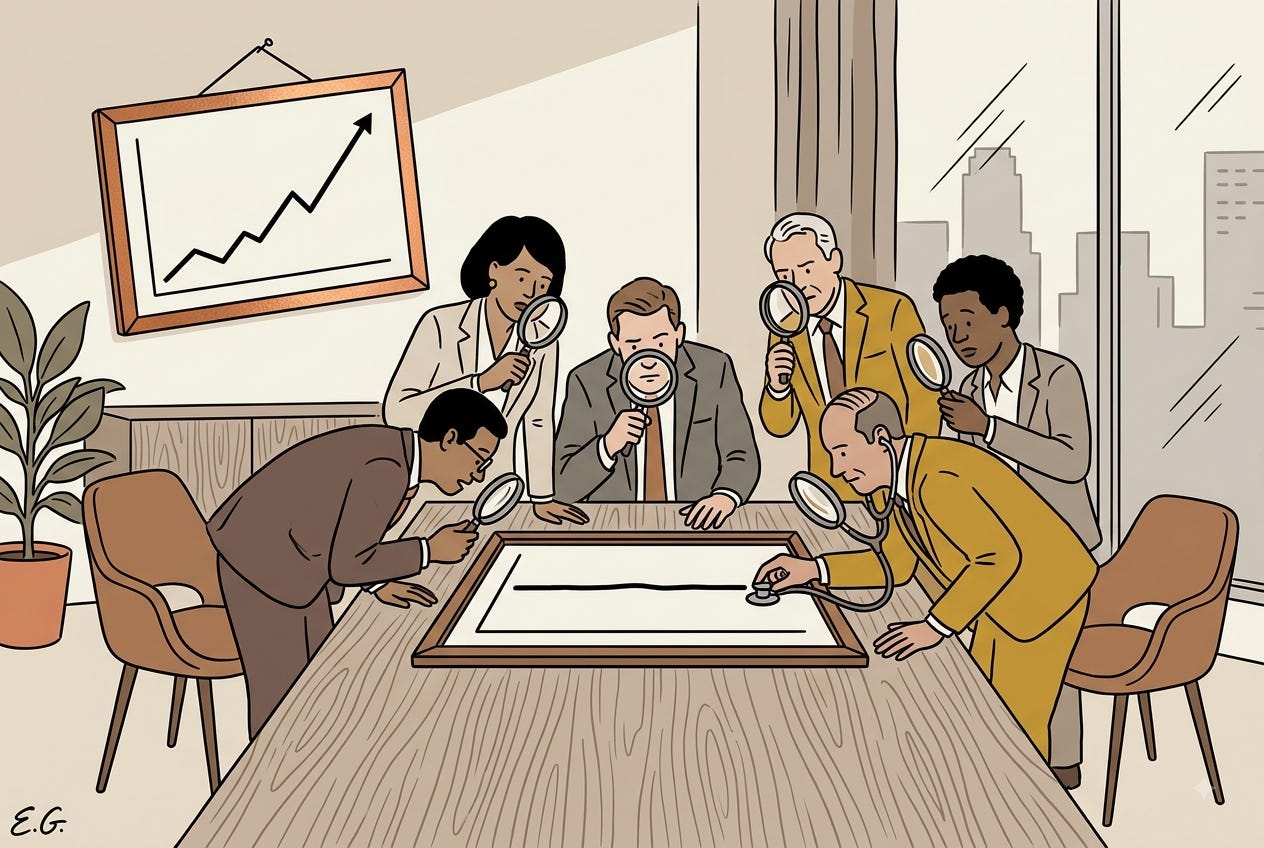
Run that next to last week’s tokenmaxxing leaderboard. One dashboard tracks the input, the other tracks the volume, and both fail to capture the only real change. Put together, they can wipe out a functioning program and, in the same quarter, give accolades to a broken one.
The roadmap ate the gains
This is my favorite number from the paper, and the abstract does not even mention it.
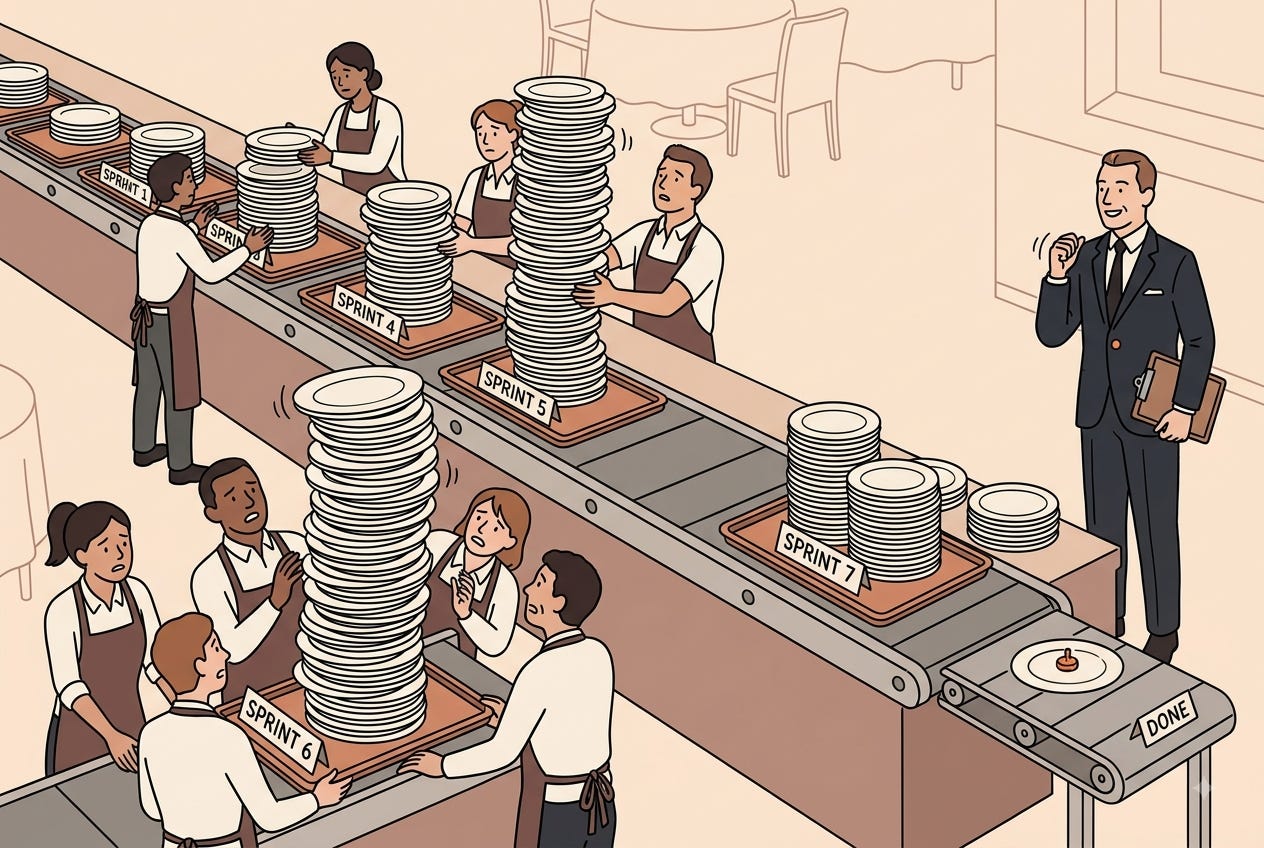
While completed points rose 59%, planned points rose about 150%, going from 447 to 1155. The team got faster, believed itself faster still, and committed accordingly. The pile of promised-but-undelivered work went from 166 points to 708. Do the completion-ratio arithmetic and it stings: before AI, the team completed about 63% of what it planned. After, about 39%.
Let’s say you are the sponsor. Your team made a genuine 59% jump in speed, and its promises got 24 points less reliable, at the same time, because of the same tool.
The paper calls this an increase in confidence in capacity. My notebook calls it an older law: capacity gains are spent before they land, and the people spending them are the ones drawing the roadmap. Remember the METR result from last week? Developers who were measurably slower felt 20% faster... speed perception inflates on contact with these tools, and roadmaps are made of speed perception.
The model dodges Herbie too
Where did the gains land? On the work that was already clean.
Satisfaction with the tools ran inversely to the messiness of the task. 75% positive on unit test coverage. About 65% on new features and test scenarios. 50% on the legacy Java and React APIs. Under 25% for ETL and legacy Kafka integration. One of the seniors in the study said the tool almost perfectly replicates test patterns for simple methods and begins to lose reliability as the methods get progressively more complex. The most complicated integration seams, where the real calendar time goes, received the least support of all.
This is where we run into Issue 5 again. The jetpack fits every scout except for Herbie, and a satisfaction survey is now available to prove it.
The constraint, as expected, also moved downstream. The paper describes collaboration shifting from shared construction to shared evaluation... less time co-writing the code and more time reviewing and integrating what the model wrote. The queue shifted to validation, which, according to Goldratt’s accounting, is now where a lost hour costs the entire system an hour.
Quality went in both directions at once. Two of the three teams reduced their high-severity static-analysis issues while shipping more (one went from 1624 issues to 825). The third team got worse on every severity. Same tools. Same training. Same firm. Whatever determined those quality outcomes, it was not the tool.
What a one-body move proves about the other two
Why is this paper relevant to this newsletter? The intervention moved just a single body, and moved it nicely. Licenses, training, and a support channel, all for the AI capability. No one adjusted the team shape. No one touched the architecture. The teams continued their routines with a new tool in the loop, and that is exactly what most enterprise AI programs opt for these days.
The fingerprints are all over the results: gains land on the well-defined work and skip the legacy seams, the review queue picks up the load, planning runs ahead of capacity, and quality goes wherever the local context pushes it. That is thirteen months of the other two bodies standing still.
What does moving the other two look like? From the notebook, generalized across engagements (clients are not content):
The review ladder changes before the tool arrives, so that review capacity becomes first-class, visible, career-grade work.
Ownership is adjusted so that one team can manage a change from start to finish, including the model’s share of it, without leaving the room. The single gates go, on purpose... the title holders remain, and the queues are eliminated.
The backlog is restructured, not re-ordered. Once the model is integrated, some tasks are no longer worth building, and some become buildable for the first time. This is the architecture body answering back.
An engaged shop buys back a real portion of the constraint’s time in the first year. In my notebook it is roughly a fifth, with a credible path to most of it. The 8-to-80 image I have carried since the first issue is an effort curve, not an audited metric. The tools will accelerate a workflow from 8 to 80 as quickly and effortlessly as a car would on an open road. From 80 to 99 is a different sport. That stretch is purchased with team shape and architecture, and no study of tools alone will ever show it... as tools alone will not get you there.
Run your own before-and-after
Use three numbers, spend one afternoon, and there is nothing to buy.
The completion ratio. Planned versus completed story points, the last four sprints compared to the four before adoption. Did completed go up while the ratio went down? That is the pattern from the paper: real gains, spent in advance by the roadmap.
The activity trap. Take a look at your main post-adoption AI chart. If it shows usage, commits, or lines, try to name one decision that it could correctly inform. In the paper, it would have scored a 59 percent gain as a zero.
The queue check. From last week’s prompt: median time-to-first-review and time-in-review, before and after the adoption. If both increased while throughput also increased, your constraint has moved downstream and is compounding quietly.
If your shapes match the paper’s, your engineers are fine. Something was waiting in your org chart, and it was there before the tools arrived.
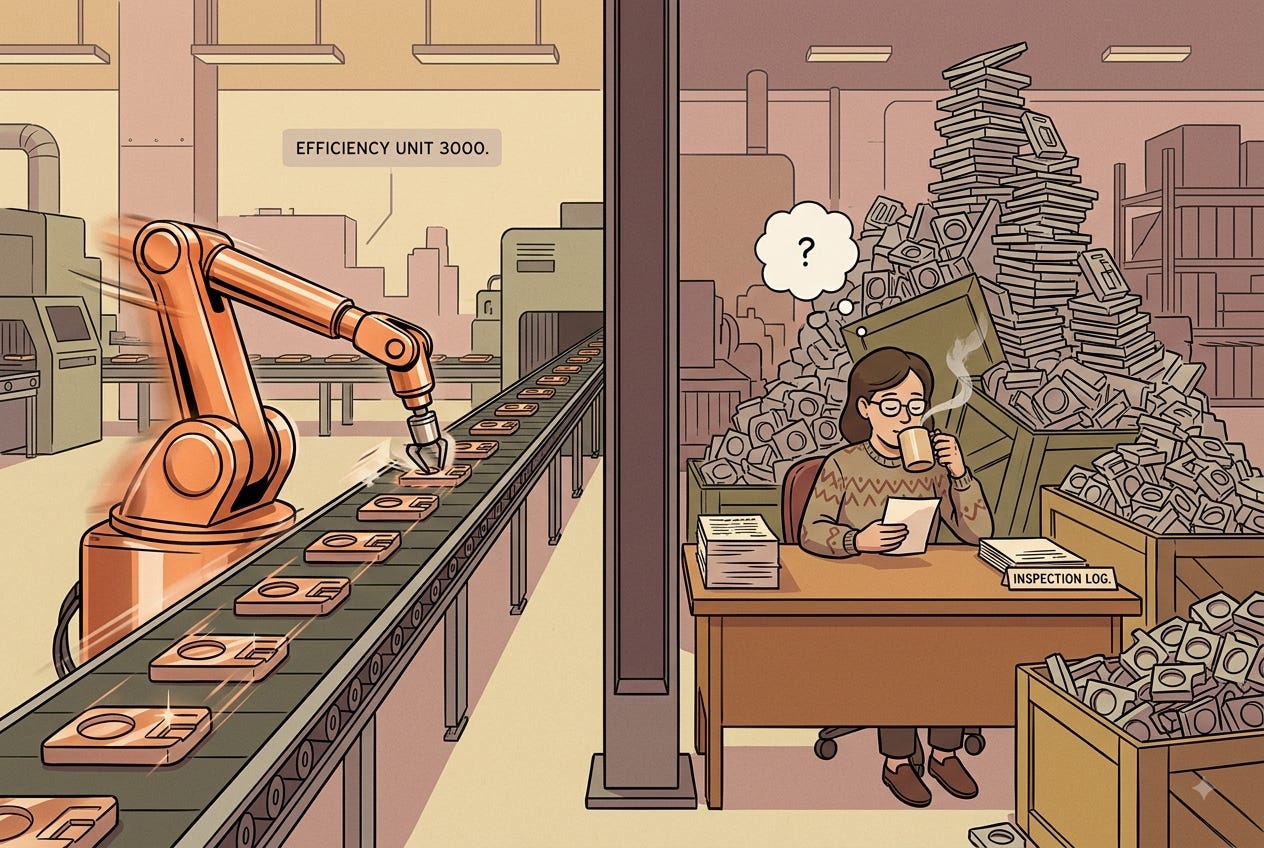
AI makes the work denser, not bigger. Measure volume and you will see nothing happen... right up until the promises stop being kept.
Coming up
Next week I climb down into the architecture body: one modernization pattern in full, the GenAI-assisted legacy rebuild. What it costs, what it returns, where it goes wrong. The pattern, not the pitch.
More soon.:-]
Sources
Because none of this comes only from my head. Every link checked.
The spine: Rafael Tomaz, Paloma Guenes, Allysson Allex Araújo, Maria Teresa Baldassarre, and Marcos Kalinowski, “Impacts of Generative AI on Agile Teams’ Productivity: A Multi-Case Longitudinal Study“ (FORGE ‘26, IEEE/ACM Third International Conference on AI Foundation Models and Software Engineering, 2026). Peer-reviewed. A small sample watched for a long time, and honest about its limits. The dataset is open on Zenodo.
The five-dimension lens the study uses: Nicole Forsgren, Margaret-Anne Storey, Chandra Maddila, Thomas Zimmermann, Brian Houck, and Jenna Butler, “The SPACE of Developer Productivity“ (ACM Queue, 2021). Practitioner venue, not peer-reviewed in the journal sense.
The lab-speed antecedent the paper builds on: Sida Peng, Eirini Kalliamvakou, Peter Cihon, and Mert Demirer, “The Impact of AI on Developer Productivity: Evidence from GitHub Copilot“ (arXiv 2302.06590, 2023). Controlled experiment, preprint, not peer-reviewed: 55.8 percent faster on a fenced task.
The perception gap, again: Joel Becker, Nate Rush, Elizabeth Barnes, and David Rein, “Measuring the Impact of Early-2025 AI on Experienced Open-Source Developer Productivity“ (METR, arXiv 2507.09089, July 2025). Randomized controlled trial, preprint, not peer-reviewed.
Herbie and the hour at the bottleneck: Eliyahu M. Goldratt and Jeff Cox, “The Goal: A Process of Ongoing Improvement“ (North River Press, 1984). Still not peer-reviewed. Still right.
I make this Substack thanks to readers like you!